
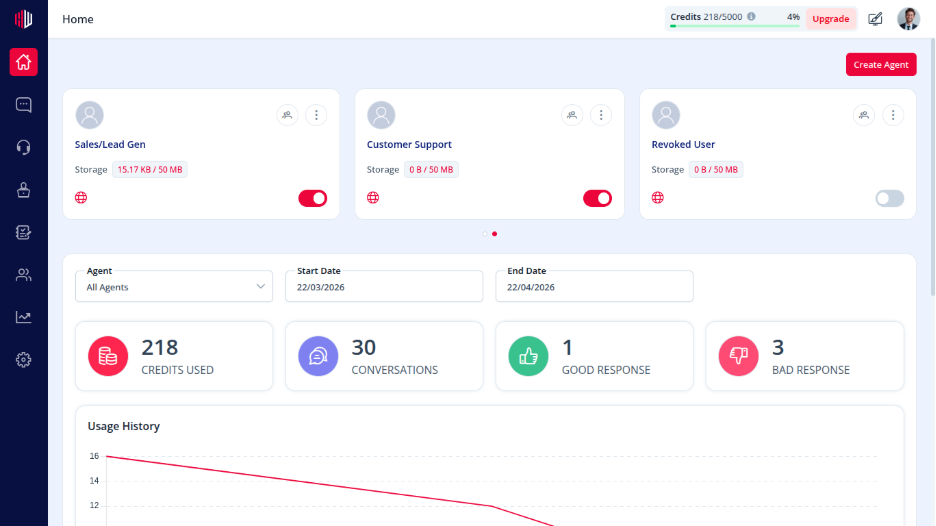
The dashboard is your central workspace in HighEngage. It gives you a quick view of your agents, usage, and performance — all in one place.
What You See on the Dashboard #
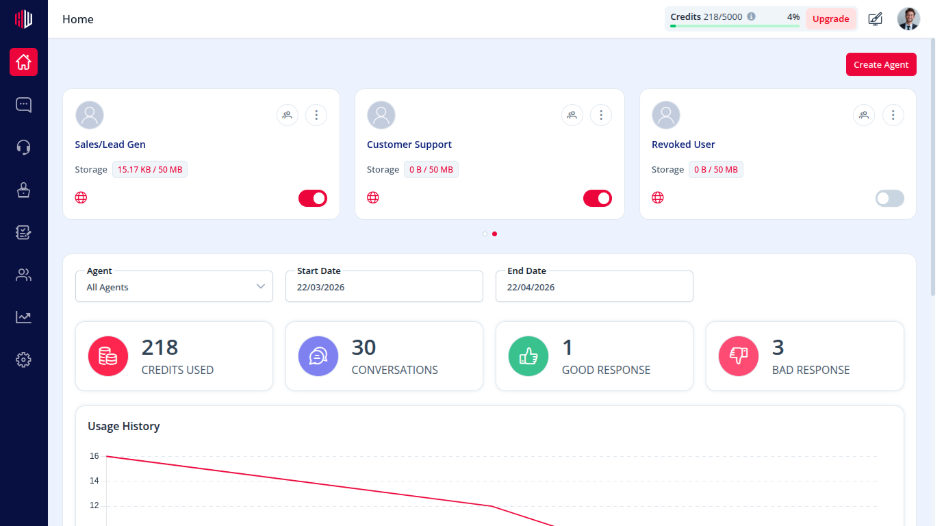
- Full dashboard view highlighting agents, metrics, and charts
1. Agent Cards #
At the top, you’ll see all your AI agents.
Each card shows:
- Agent name (e.g., Lead Generation, Appointment Booking)
- Storage usage
- Channel availability
- Toggle to activate or deactivate the agent
- Preview
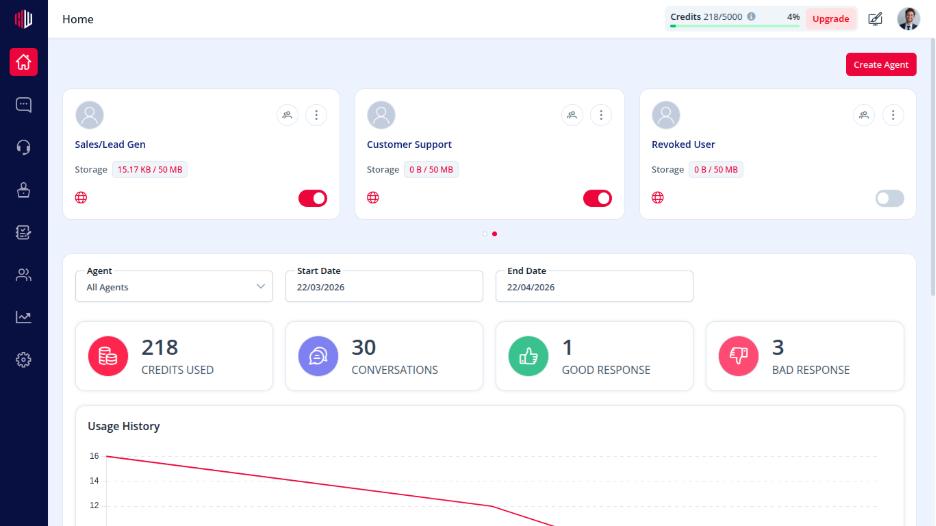
You can also create a new agent using the Create Agent button.
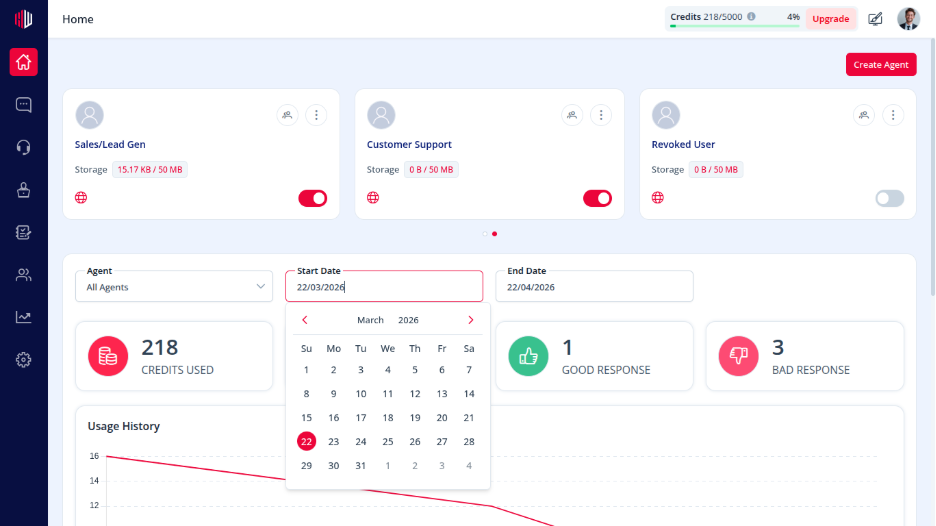
2. Filters #
Below the agent cards, you can filter your data and view analytics:
- Agent filter → View data for a specific agent or all agents
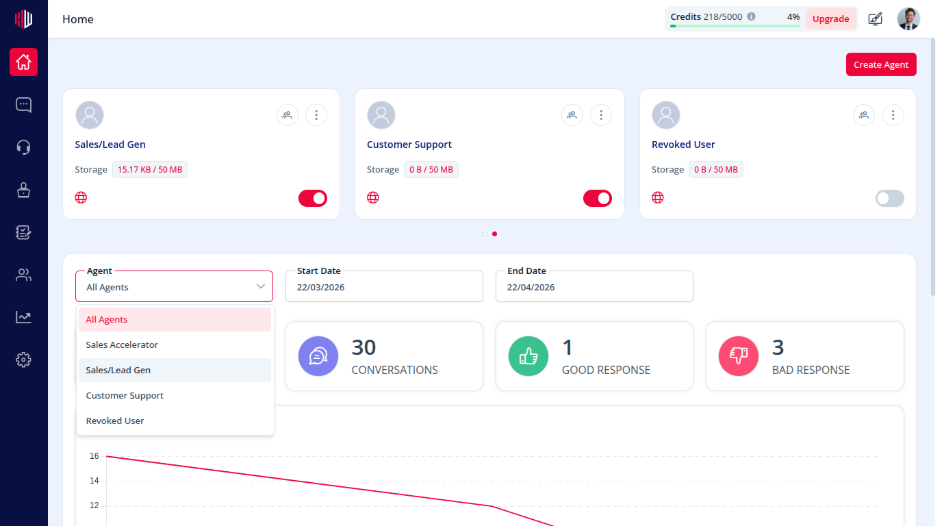
- Date range → Analyze performance for a selected time period
3. Key Metrics #
The dashboard provides a quick summary of performance:
- Credits Used → Total credits consumed in that time period
- Conversations → Number of overall chats handled
- Positive Responses → Number of positive user feedback received
- Negative Responses → Number of negative user feedback received
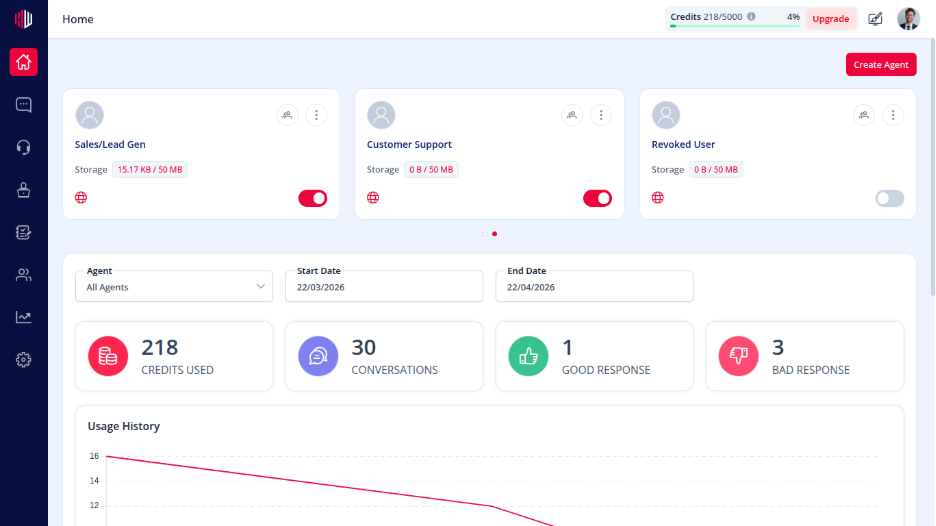
These metrics help you understand how your agents are performing at a glance.
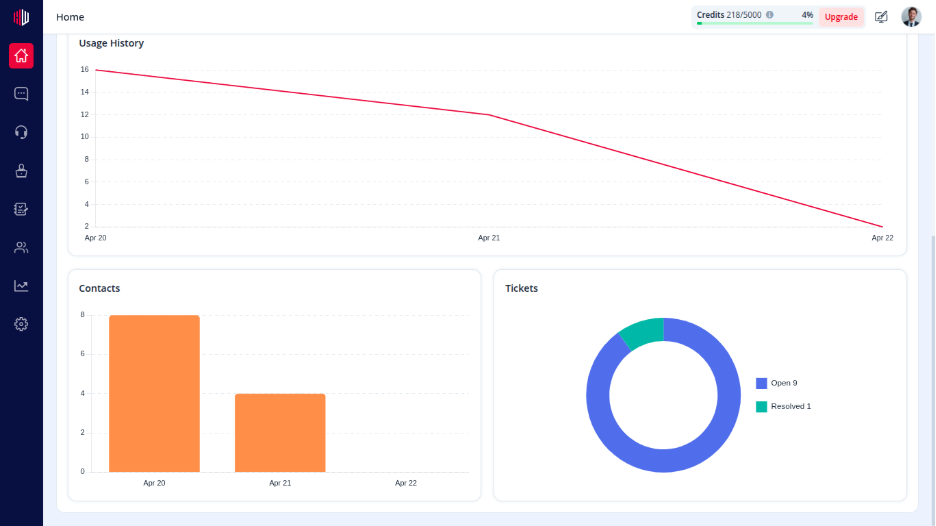
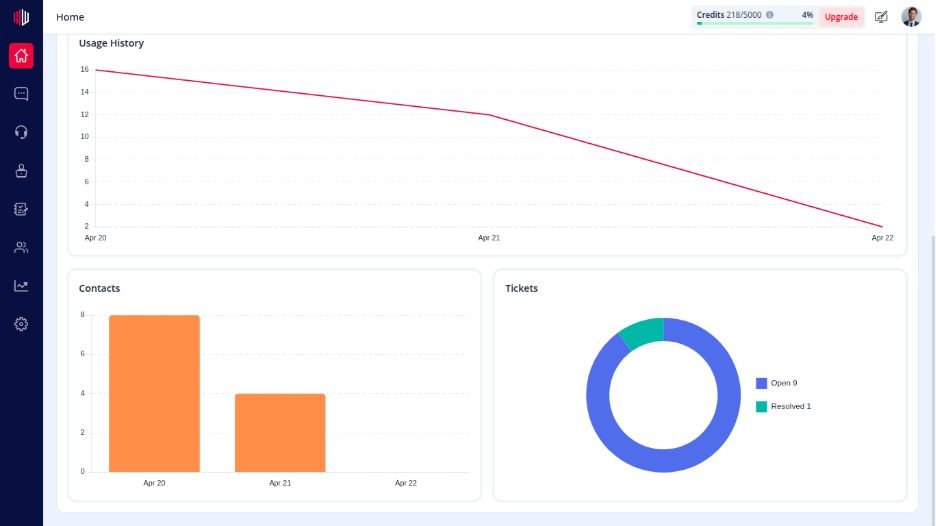
4. Usage History #
A line chart shows how your usage trends over time.
Use this to:
- Identify peak activity periods
- Track growth in conversations
- Monitor credit consumption patterns
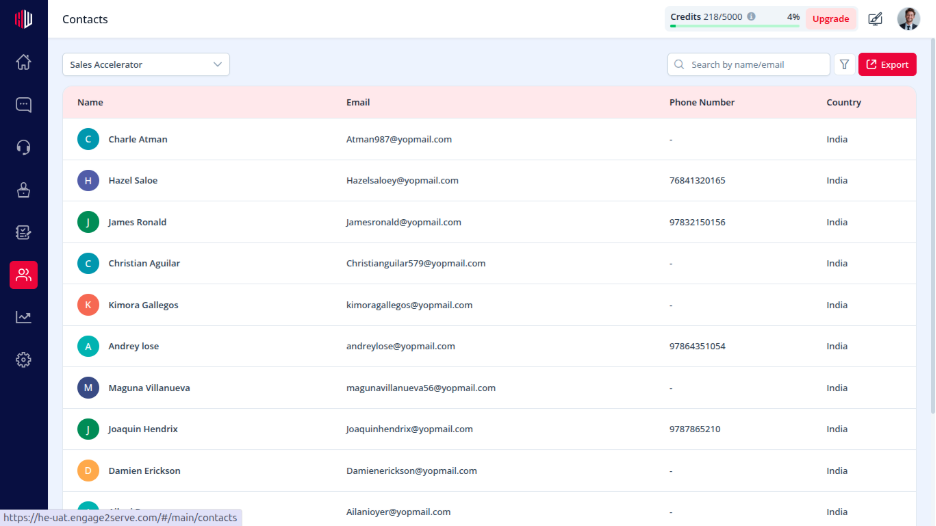
5. Contacts #
This section shows how many leads or contacts are being generated over time.
It helps you understand:
- Lead growth
- Engagement trends
- Conversion opportunities
6. Tickets #
The ticket section displays the status of support or handover requests:
- Open tickets
- Resolved tickets
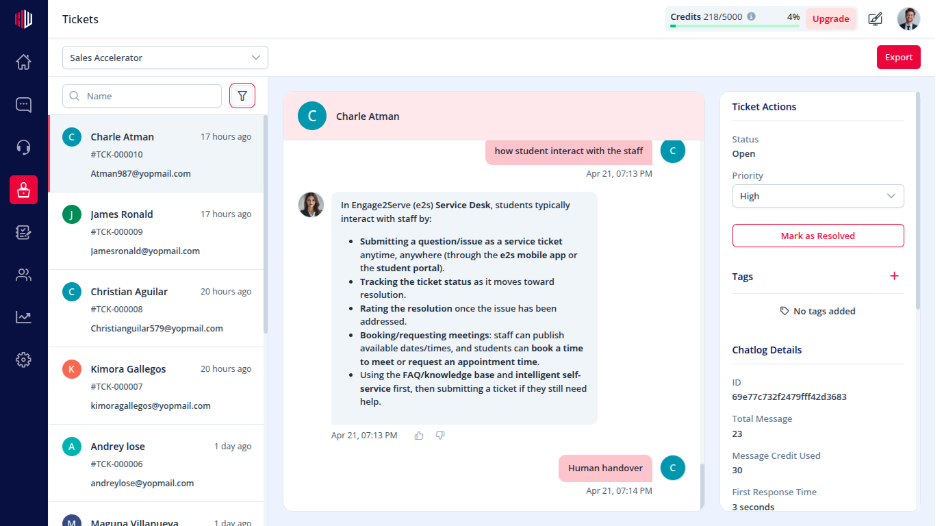
This gives visibility into how many conversations require human intervention.
Why the Dashboard Matters #
The dashboard helps you:
- Monitor performance in real time
- Track usage and limits
- Identify areas to improve your AI agent
If you have any questions, concerns, or need further clarification, please contact support@highengage.com for assistance.


